Information on premises, business ages and business survival rates
Premises
The analysis of the industrial structure highlighted sectors with higher or lower business representation in
the
Figure 1 Commercial Premises – Count and Floorspace, 2008
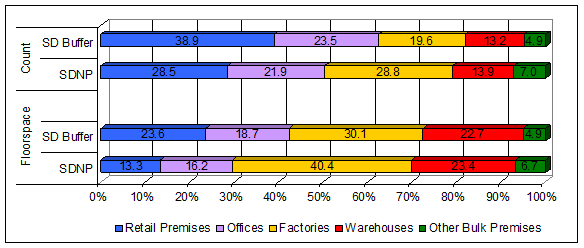
Source: Hampshire County Council (September 2011) South Downs Local Economy Report: Neighbourhood Statistics, Commercial and Industrial Floorspace and Rateable Value Statistics (2005 Revaluation), MSOA level, Hampshire County Council
Business Ages
Compared to the buffer area and the South East, the
majority (46 per cent) of businesses in the
Figure 2 Enterprises by age, 2010
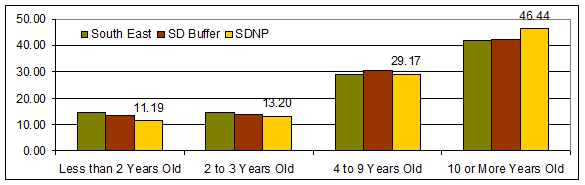
Source: Hampshire County Council (September 2011) South Downs Local Economy Report: Neighbourhood Statistics, Enterprises by Age of Business, MSOA level, Hampshire County Council
Business births, deaths and survival rates
Business births in the
Figure 3 Business births per 10,000 16+ population
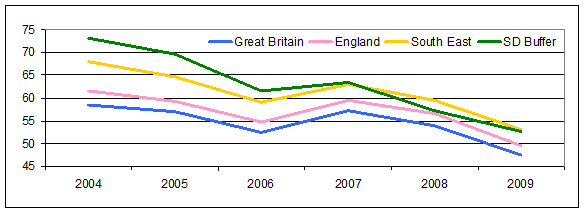
Source: Hampshire County Council (September 2011) South Downs National Park Local Economy: Business Demography 2009, District level, Hampshire County Council
Figure 4 Business deaths per 10,000 16+ population
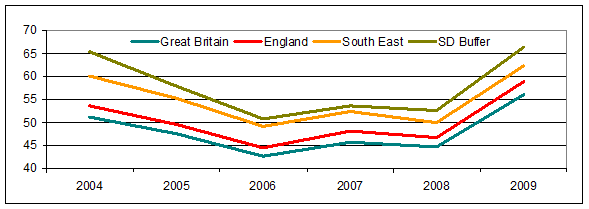
Source: Hampshire County Council (September 2011) South Downs National Park Local Economy: Business Demography 2009, District level, Hampshire County Council
Figure 5 Business Survival rates
Births |
1 Year |
2 Years |
3 Years |
4 Years |
5 Years |
|
Great Britain |
274,350 |
94.2 |
78.7 |
65.2 |
54.6 |
46.7 |
England |
248,450 |
94.2 |
78.7 |
65.2 |
54.5 |
46.6 |
South East |
44,345 |
94.5 |
80.2 |
66.9 |
56.4 |
48.7 |
SD Buffer |
11,420 |
94.6 |
80.7 |
68.3 |
58.4 |
50.6 |
Source: Hampshire County Council (September 2011) South Downs National Park Local Economy: Business Demography 2009, District level, Hampshire County Council